Reference: Mediation Modeling at Uber: Understanding Why Product Changes Work (and Don’t Work)
Scenario formulation
We start with the most straight ideal case for the uplift modeling. Suppose we have a dataset satisfy the following properties:
- The dataset is not confounded (e.g. RCT setup)
- All users receive the treatment effect
- The treatment effect has the same effects on the users
With the properties, we could use average treatment effects (ATE) to represent the effects brought by the treatment. The below is an example setup:
- Scenario: Uber drivers might file supporting tickets to ask for explanation of their earnings. We want to reduce the number of supporting tickets by showing earning graphs to drivers.
- Treatment: Showing earning graphs to drivers
- Outcome \(Y\): The number of filed supporting tickets
Mediation modeling formulation
However, sometimes we want to know how important a mediator is for the treatment effects. For example, the mediator in this case could be the understanding of the graphs. We want to know if the ATE is caused by the fact that drivers understanding the graph or simply by seeing there is an earning graph without understanding it would have the same treatment effects. So the mediator is
- Mediator \(M\): Understanding of earning graphs
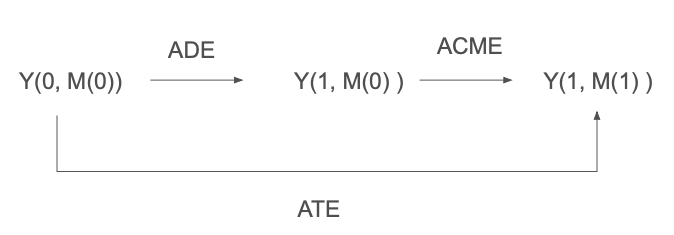
With the above setup, we model that ATE could be decomposed into two elements: ATE = ADE (average direct effect) + ACME (average causal mediated effect )
- ATE: The total effect
- Which usually we model as \(\mathbb{E}[Y(1, M(1)) - Y(0, M(0))]\) where \(M(1)\) means the mediator is turned on or exists. \(Y(T, M(m))\) indicates whether the treatment \(T\) is applied and whether the mediator exists.
- ADE: ADE is the impact from the treatment on the outcome that does not go through the mediator.
- Which usually we would model it as \(\mathbb{E}[Y(1, M(0)) - Y(0, M(0))]\), \(M(0)\) means the moderator is turned off or not exists.
- ACME: ACME corresponds to the difference in potential outcomes that would occur if we were to flip the mediator into the value it would take under the treatment status while holding the treatment status itself fixed.
- Which usually we would model it as \(\mathbb{E}[Y(1, M(1)) - M(1, M(0))]\)
Example
- Goal: Using the setup above, we want to quantify how much of the supporting tickets reducing could be attributed to that the graphs helps the driver understanding their earnings more
Step 1: Estimate ATE
Suppose in our dataset we see that
- Treatment group average support tickets per driver: 0.80
- Control group average support tickets per driver: 1.00
So, \(ATE = 0.80 - 1.00 = -0.20\). This means the graph reduces tickets by 0.20 per driver.
Step 2: Estimate ACME
It breaks down into two parts.
Part1: Fit a model for the mediator
We want to know how showing the graphs could help drivers understanding.
- We use user survey data to represent the driver’s understanding.
- In the survey, 5 indicates understanding well and 1 indicates the opposite. We conducted the user survey for drivers with and without showing the earning graphs. (Our treatment and control groups.)
- We train a model with the dataset whose label is the survey score.
With the above, we could use the model to estimate the ATE regarding the driver understanding. Suppose we have
\[\mathbb{E}[M∣T=1]−\mathbb{E}[M∣T=0]=0.05\]The above shows that showing the earning graphs could increase the drivers’ understanding by 0.05.
Part2: Fit a model for the outcome
Secondly, we want to know how improving the understanding would influence the outcome which is the number of filed supporting tickets for the treatment group users.
- We train a model using treatment group driver’s understanding as the input and whether the driver file the ticket as the label.
- For simplicity, we model it as a simple linear function
Suppose we found the slope of the linear function is \(\frac{dY}{dM}=-0.75\). It’s saying as we increase the understanding score by 1 we would reduce 0.75 tickets under the treatment.
Part 3: ACME estimation
Combining the above two parts, we know that
- The earning graphs could increase the drivers’ understanding by 0.05
- If we increase the understanding score by 1 we would reduce 0.75 tickets under the treatment
Therefore, the overall impacts on the outcome caused by the increased understanding (ACME) is \(0.05 * -0.75 = -0.375\) tickets
Step 3: Calculate the Proportion Mediated
With the previous two steps, we know: -Total effect (ATE) = -0.20
- Mediated effect (ACME) = -0.0375
We have proportion mediated \(ATE/ACME =−0.20/−0.0375 =0.1875\)
The interpretation would be out of the 0.20 ticket reduction:
- 0.0375 tickets were reduced because of improved understanding (mediated effect)
- The rest (0.1625 tickets) came from other factors (direct effect).